
Home · Call center dashboard
Call center dashboard for Microsoft Teams
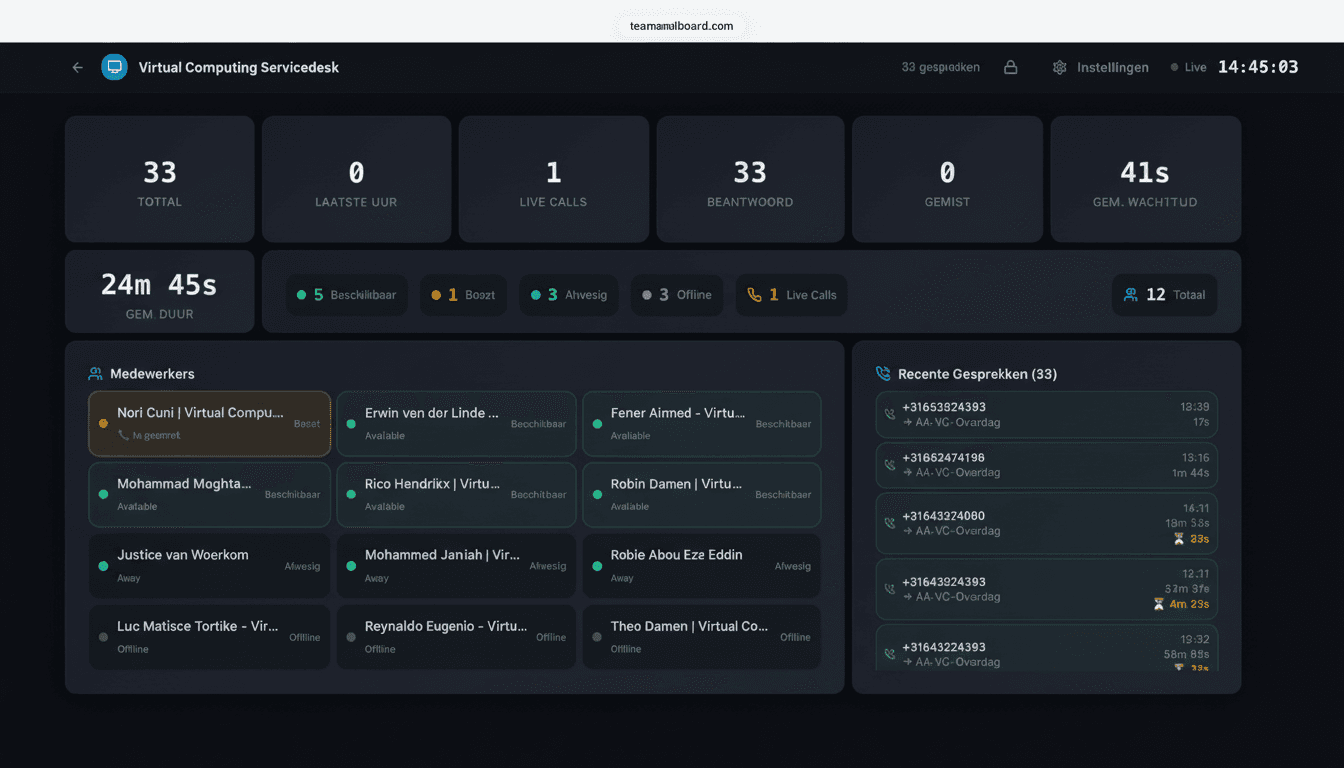
Build a call center dashboard that shows how your phone team is doing, live — calls in queue, wait time, service level, abandonment and agent presence. Every number comes straight from Microsoft Teams via the Graph API, with no separate call center platform. Watch it on your own screen or share it as a wallboard on a TV in the department.
Live queue
See instantly how many calls are waiting, for how long and in which queue — so you can step in on time.
Service level & SLA
Service level percentage, abandonment rate and average wait time at a glance, updated in real time.
Agent presence
Who is available, busy, on a call or away — built for team leads and floor managers.
What belongs on a call center dashboard?
A good call center dashboard answers one question at a glance: are we falling behind, and where? That is why Teams Wallboard combines the operational numbers that matter right now with a historical view for your reporting:
- Live calls in queue — how many callers are waiting at this moment, per queue.
- Wait time & service level — average and longest wait plus the percentage within your SLA.
- Abandonment rate — how many callers hang up before they are helped.
- Agent presence — available, busy, on a call or away, live from Teams.
- Answered today — volume and average call duration, with a trend chart.
Service level: the number you manage by
Service level is the percentage of calls answered within your target time. A common standard is 80/20: 80% of calls answered within 20 seconds. The right target depends on your team — an internal IT helpdesk is fine at 90/60, while a commercial customer service line usually wants it tighter. What matters more than the exact target is having the number live on the wall: a service level sliding from 92% to 78% is your earliest signal to add capacity, well before callers start complaining.
Wait time: average and longest
Average wait time hides outliers. Ten callers who wait 20 seconds plus one caller stuck in the queue for six minutes still produce a respectable average — while that one caller files a complaint tomorrow. So put the longest current wait time next to the average on your dashboard. That is the number a floor manager reacts to immediately.
Abandonment rate: the silent leak
Abandonment rate is the percentage of callers who hang up before an agent answers. For customer service, every abandoned call is a disappointed customer; for sales, it is literally missed revenue. Below 5% is generally healthy; consistently above 8% points to a staffing problem. Because abandonment correlates directly with wait time, the two numbers belong side by side on the board.
Agent presence: who can jump in right now?
Microsoft Teams always knows who is available, busy, on a call or away. On a wallboard that presence becomes genuinely useful: a team lead sees at a glance that three calls are waiting while two agents have been on away for ten minutes. Presence comes live from Teams, so it is accurate for remote workers and flex desks too.
Real-time versus historical
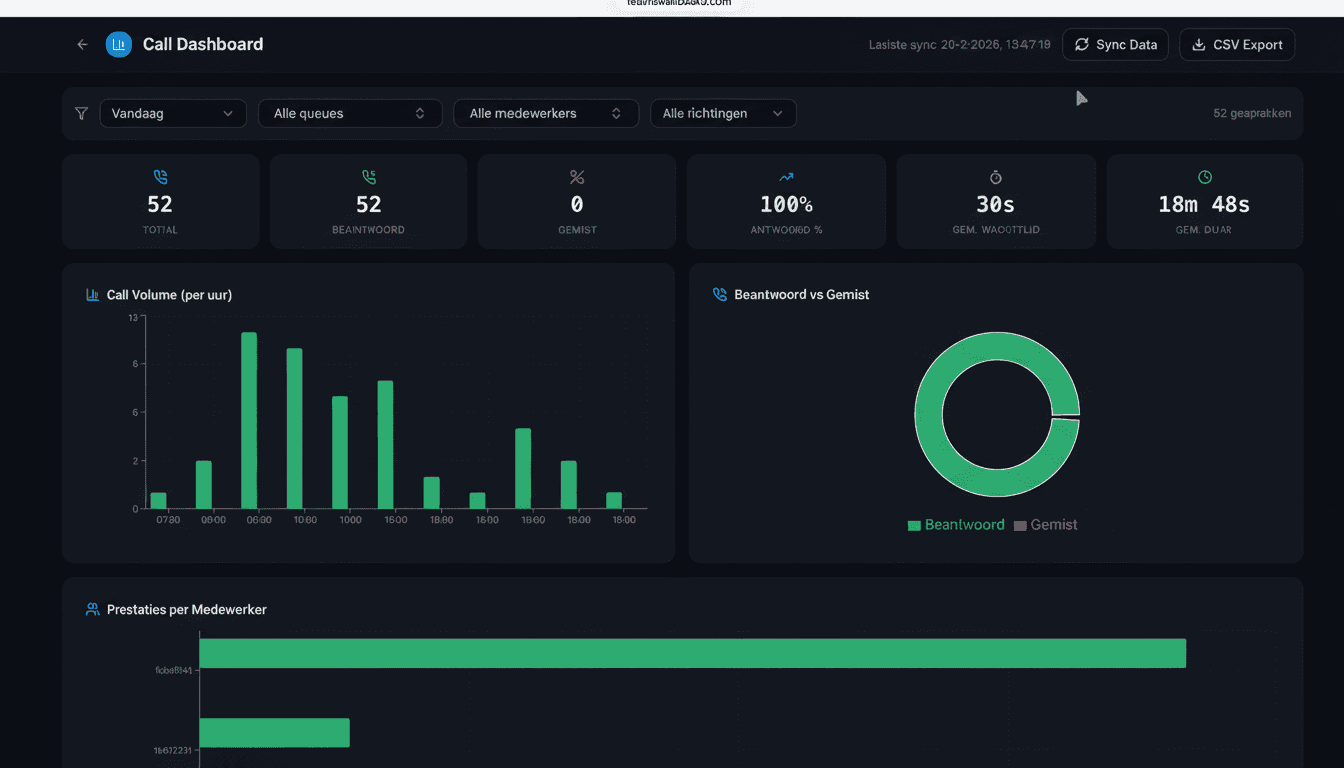
A wallboard on a TV is about right now; reporting is about yesterday and last month. You need both. The live wallboard in Teams Wallboard refreshes every 30 seconds, and the analytics dashboard behind it shows trends per hour, day, queue and agent — including CSV export for your monthly reporting or Power BI.
Keep it readable
The biggest mistake on call center dashboards is trying to show everything. A good wallboard has five to seven widgets, numbers readable from twenty feet away, and color that means something: green within target, red outside it. In Teams Wallboard you drag widgets onto the board, give your most important KPI the biggest panel and lock the layout once it works.
How do the numbers get out of Microsoft Teams?
Teams Wallboard reads everything through the official Microsoft Graph API. You connect your Microsoft 365 tenant with a single OAuth login — it takes less than two minutes and requires no installation or Teams admin center changes. We read presence and call records only, never chat messages or files. From there, your first wallboard is live within 5 minutes and every screen refreshes automatically every 30 seconds.
The only requirement: a Microsoft 365 tenant with Teams Phone. It does not matter whether you call through Calling Plans, Operator Connect or Direct Routing — every Teams Phone configuration works.
Doesn't Teams have its own dashboard? The Queues app compared
Microsoft ships its own Queues app for Teams: a solid app that gives agents and supervisors real-time queue metrics inside the Teams client, including supervisor features like monitor, whisper and barge. It comes with a price tag, though — the Queues app requires Teams Premium licenses per user — and it is built for life inside the Teams client, not for a TV on the wall. Here is how the two stack up:
| Feature | Microsoft Teams Queues app | Teams Wallboard |
|---|---|---|
| Real-time queue metrics | Inside the Teams client, per queue | In any browser, on any screen |
| Wallboard on a TV | No public display mode | Public link, Yodeck, ScreenCloud |
| Sharing without a Teams login | Teams client only | Link with PIN and IP whitelisting |
| Custom drag-and-drop layouts | Fixed view | Unlimited wallboards, 12 widgets |
| KPI dashboard across queues | Per-queue view | Combine queues on one board |
| CSV export of call analytics | Not available | For reporting or Power BI |
| Monitor, whisper & barge | For supervisors, with Teams Premium | Deliberately no coaching features |
| Managing agents in queues | Opt-in and opt-out per agent | Read-only dashboard |
| Flat price per organization | Teams Premium license per user | €10/month, unlimited users |
Fair is fair: if you need monitor, whisper and barge, or want to opt agents in and out of queues from the dashboard, the Queues app is the right choice — or run both side by side. Teams Wallboard focuses on what the Queues app deliberately does not do: big screens on the wall, public links, custom layouts and exportable analytics, for one flat price per organization instead of per-user licenses.
For floor managers, helpdesks and customer service
Whether you run an IT helpdesk, a customer service team or a reception desk: a live call center dashboard on the wall makes the workload visible to the whole team. Team leads see the queue building the moment it happens and can add agents — without digging through the Teams admin center first. With drag-and-drop you build each team its own wallboard with exactly the KPIs that matter to them.
SMB IT helpdesk
One support number, three people on the desk and a Monday-morning peak. A wallboard on the team room TV shows when the queue builds up, so second line jumps in for a while. No per-user licenses needed.
Customer service
Service level and abandonment live on the wall turn your SLA into a team goal instead of a report after the fact. Team leads see the impact of an outage or campaign immediately and add capacity before the service level drops below target.
Sales teams
Outbound calls per agent, average call duration and a top performers leaderboard on the sales floor TV. Healthy competition without an expensive CRM dashboard — the numbers come straight from Teams.
Reception and lobby
A calm wallboard with availability and staffing shows visitors a professional operation. With PIN protection and IP whitelisting you decide which numbers are publicly visible and which stay internal.
Share it on the wall, safely: public wallboard links can be protected with a 6-digit PIN and IP whitelisting, so only your own screens get access.
Frequently asked questions
What is a call center dashboard?
A call center dashboard shows how your phone team is performing in real time: how many calls are waiting in the queue, the average wait time, the service level, answered and missed call counts, and which agents are available or on a call. With Teams Wallboard, all of that data comes straight from Microsoft Teams via the Graph API.
Does the call center dashboard work with Microsoft Teams?
Yes. Teams Wallboard is purpose-built for Microsoft Teams call queues. You connect your Microsoft 365 tenant with a single OAuth login and we read call records and agent presence through the official Microsoft Graph API. No installation or admin center changes required.
Doesn't Microsoft Teams already have a call center dashboard?
Partly. Microsoft's Queues app shows real-time queue metrics inside the Teams client and gives supervisors monitor, whisper and barge — but it requires Teams Premium licenses per user. What the Queues app does not offer: wallboards on a TV, public shareable links, custom drag-and-drop layouts, KPI dashboards across multiple queues, or CSV analytics export. That is exactly the gap Teams Wallboard fills, for €10 per month per organization.
Can I show the call center dashboard as a wallboard on a TV?
Yes. Every dashboard can be shared as a public wallboard link with PIN protection and IP whitelisting. Open the link on a TV, Yodeck or ScreenCloud player and your call center sees the numbers live on the wall. The wallboard refreshes automatically every 30 seconds.
Which KPIs can I put on the call center dashboard?
Live calls in queue, average and longest wait time, service level percentage, abandonment rate, agents available/busy/away, calls answered today, average call duration and trend charts — all drag-and-drop, combined however you like per wallboard.
How much does a call center dashboard for Teams cost?
You start with a 14-day free trial, no credit card required. After that it is €10 per month per organization, with unlimited wallboards, users and queues. Cancel monthly.
Get your call center dashboard live in 5 minutes
Connect Microsoft Teams, drag your KPIs onto a wallboard and share it on any screen. Free for 14 days.
No credit card required · €10/month after trial · cancel monthly
Prefer a walkthrough for your team first? Book a demo →